- Getting Started
- Administration Guide
-
User Guide
- An Introduction to Wyn Enterprise
- Document Portal for End Users
- Data Governance and Modeling
- Working with Resources
- Working with Reports
-
Working with Dashboards
- Dashboard Designer
- Selecting a Dataset
- Data Attributes
- Dashboard Scenarios
- Dashboard Templates
- Component Templates
- 3D Scene
- Explorer
- Visualization Wizard
- Data Analysis and Interactivity
- Dashboard Appearance
- Preview Dashboard
- Export Dashboard
- Dashboard Lite Viewer
- Using Dashboard Designer
- Animating Dashboard Components
- Document Binder
- Dashboard Insights
- View and Manage Documents
- Understanding Wyn Analytical Expressions
- Section 508 Compliance
- Subscribe to RSS Feed for Wyn Builds Site
- Developer Guide
Dashboard Parameters
Dashboard parameters are global parameters that are used to filter the data in a dashboard. Dashboard parameters can be added to global filters, scenario filter, dashboard jumps, and scheduled tasks to control the output in the underlying scenario.
with Wyn Enterprise, you can use MultiValue parameters in your dashboard scenarios. MultiValue parameter allows you to pass one or more input parameters to the report. With MultiValue parameters, you can also pass all the parameters to the report using the Select All option.
In this article, you will find information on the following,
Add a Dashboard Parameter
To add parameters to a dashboard, navigate to the dashboard designer page and follow the below instructions,
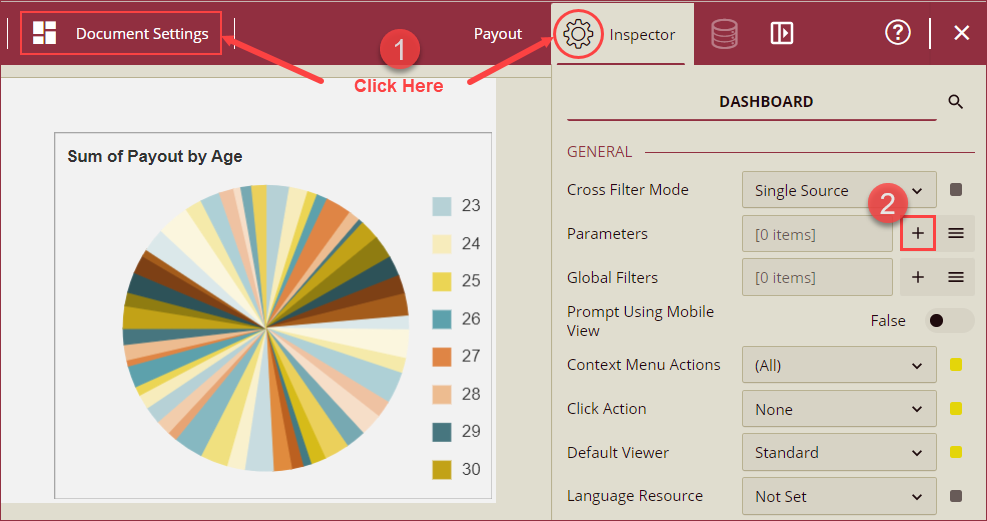
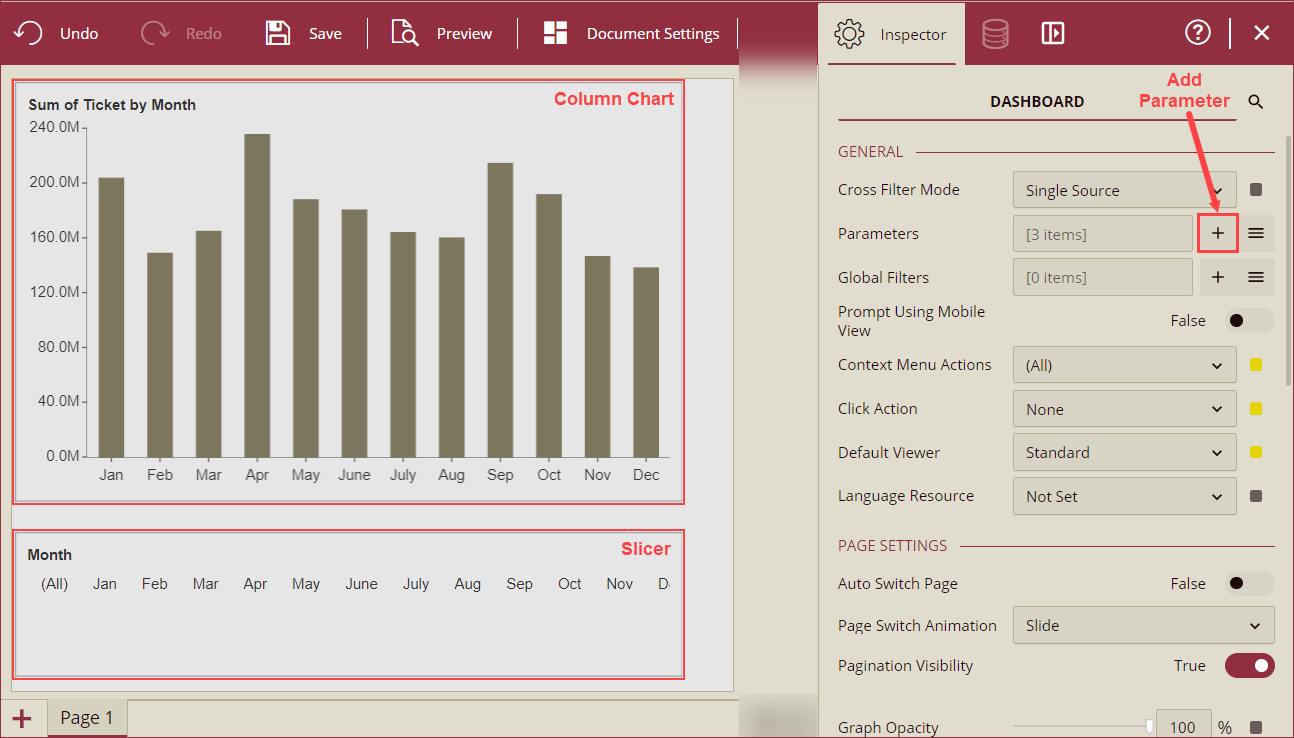
Click the Document Settings tab on top of the designer or click the Inspector panel icon on the right side and go to the Parameters property under General section.
Click + Add Item icon. Parameter Setting dialog box will appear on your screen. The attributes of the Parameter Settings dialog box are listed and described in this section.
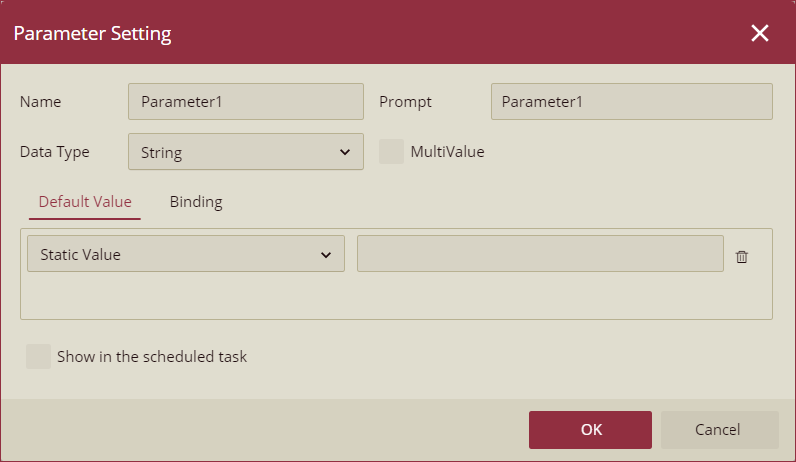
In the Parameter Setting dialog, specify the name for the dashboard parameter in the Name property.
In the Prompt input box, add text to display on the user interface to request an input. By default, this is same as the Name property.
Choose a suitable data type for the parameter from the Data Type dropdown and ensure that it matches the data type of the attribute it filters. Data type options in the dialog are Boolean, Date, DateTime, Integer, Float, String, and Multi Dimension. For example, set the Data Type property to String if you want to apply a filter on a data attribute of type String. Data type options are listed and explained in this section.
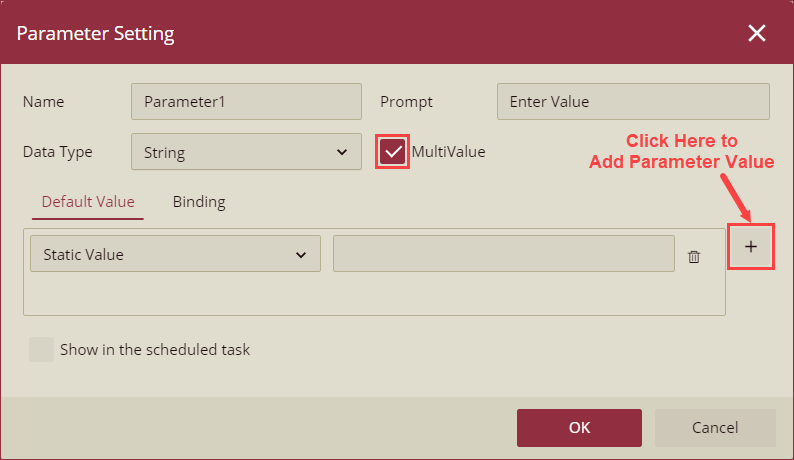
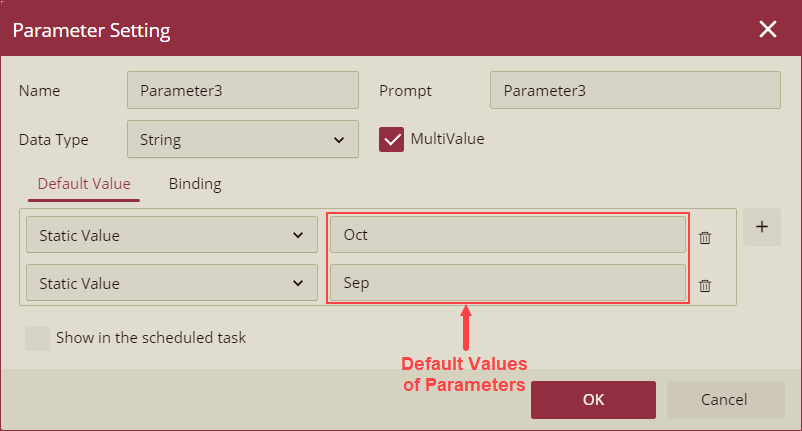
To add multi-value parameters, select the MultiValue checkbox. On checking, a + button will appear next to the Default Value input box. Click the + button to add multiple parameter values.
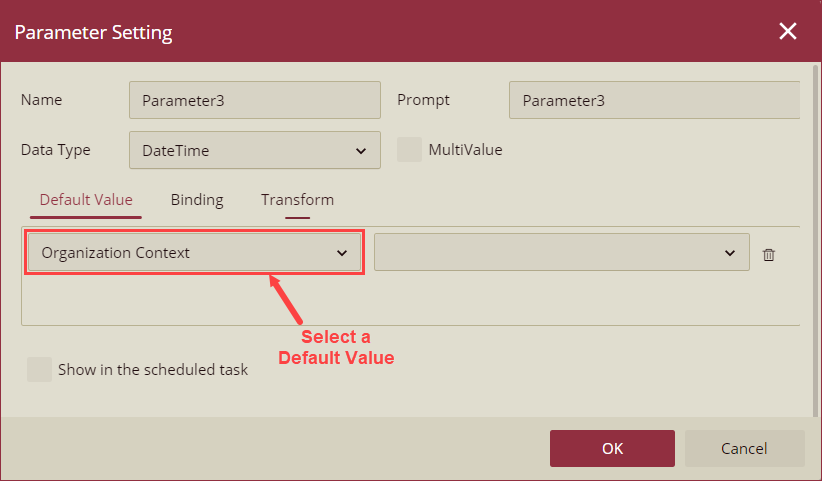
From the Default Values tab of the dialog, specify the default value(s) for the dashboard parameter. You can select Static Values, User Context Values, Organization Context Values, and dataset values (From Query) as the default values from the dropdown. Default Value options are listed and explained in this section.
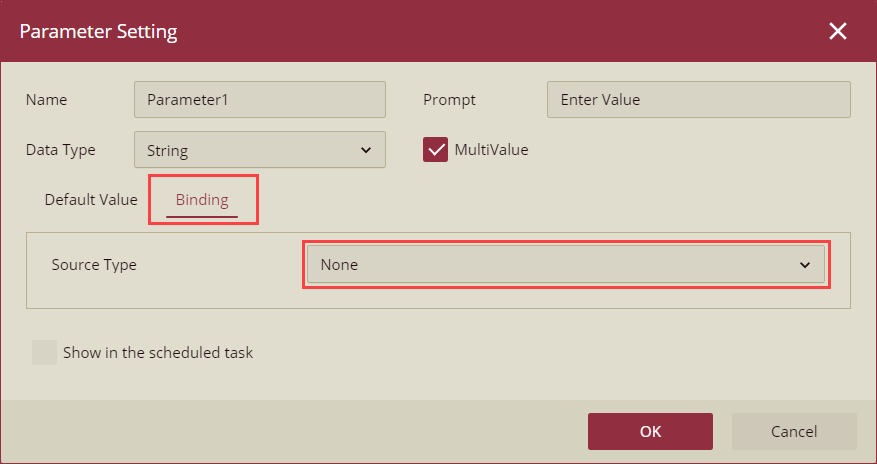
From the Binding tab, select the Source Type from the dropdown. You can choose one of the following three options - None, Selected Value, or Slicer. Binding options are listed and described in this section.
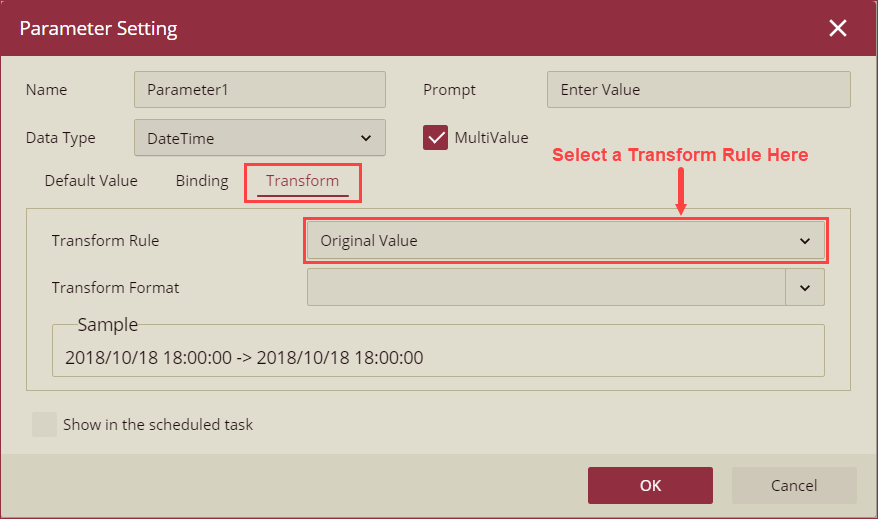
In case you select the Date or DateTime data type option from the Data Type dropdown, the Transform tab will appear next to the Binding tab. Select a Transform Rule from the dropdown and set the appropriate settings. You can choose one of the following options from the Transform Rule dropdown - Original Value, Part, Adjust Value, or UTC String. Transform Rule options are listed and described in this section.
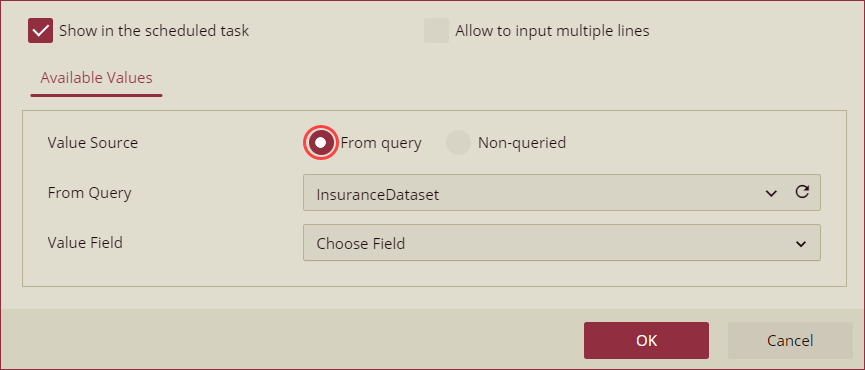
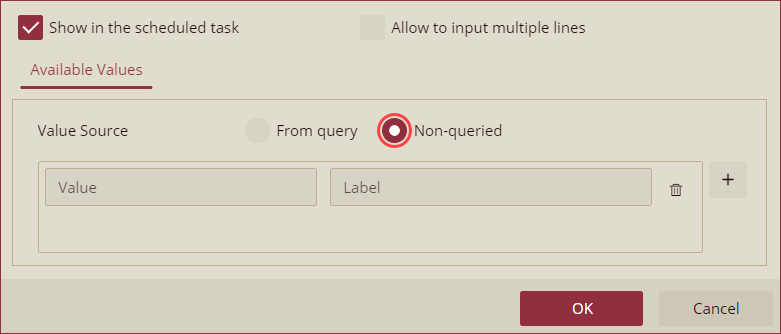
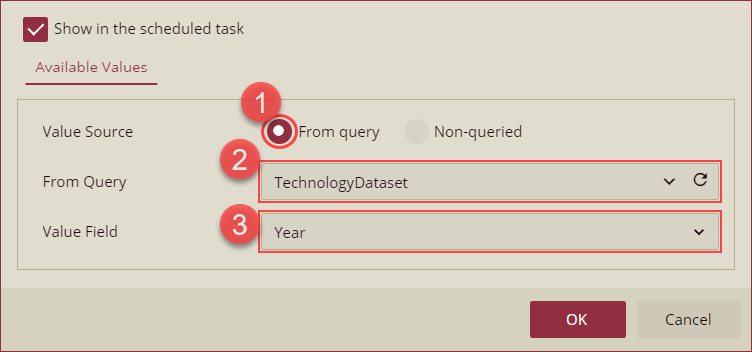
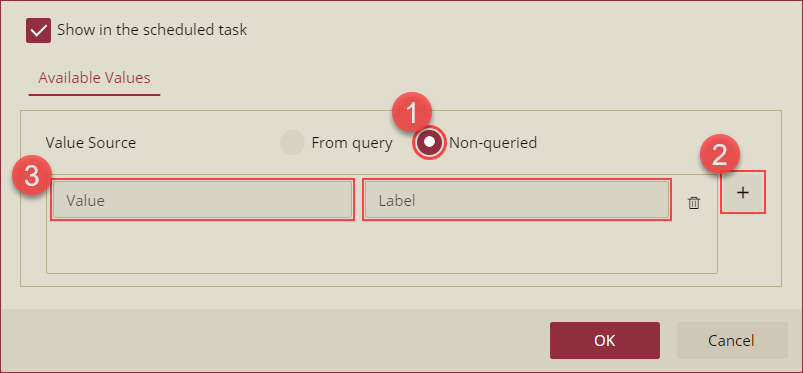
Click the Show in the scheduled task checkbox to show the dashboard parameters in scheduled tasks. On clicking the checkbox, the Available Values tab will appear at the bottom of the dialog, now select one of the options from the Value Source. The following two options are available,
a. In the case of From Query, select a dataset from the From Query dropdown and then select a data field from the Value Field dropdown.
b. In the case of Non-queried, enter a value in the Value input box and a label for the value in the Label input box. To add multiple values, use the + icon on the right side. Click the delete icon to remove the value field.
Click OK to save the parameter. The new parameter appears in the Dashboard Parameters in the global settings panel.
Parameter Setting Dialog Box
The following table lists and describes the attributes of the Parameter Setting dialog box,
Item | Description |
|---|---|
Name | Specify the name for the dashboard parameter. |
Prompt | Add a text to display on the user interface to request input. |
Data Type | Choose a suitable data type from the dropdown. The following options are available in the dropdown - Boolean, Date, DateTime, Integer, Float, String, and Multi Dimension. |
MultiValue | Click the checkbox to add multiple values in the Default Value section to filter multiple values in the data. |
Default Value | Add default values of the dashboard parameters in this tab. You can provide Static Value, User Context, Organization Context, and From Query. |
Binding | Bind parameters to slicers or selected values in this tab. You can select None, Selected Value, or Slicer options from the Source Type dropdown. |
Show in the scheduled task | Click this checkbox to show the dashboard parameters when scheduling a task using the Add Task feature. |
Data Types Options
Boolean - Stores True or False data values.
Date - Stores the calendar date.
DateTime - Stores both date and time parts.
Integer - Stores whole numbers.
Float String - Stores floating point or decimal number.
Multi Dimension - Stores one or more independent variables in a hierarchical structure. In Wyn Enterprise, multi-dimensional parameters are supported with Multi-dimensional Slicers and Multi-dimensional Dropdown Slicers. See this example on using multi-dimensional parameters.
Default Values Options
Static Value - Static values are used to filter out data using fixed values. Add a constant value in the input box to set the default value of the parameter.
User Context - User Context values are used to dynamically filter the data using certain user attributes. To filter data based on user context, select an option from the following - email, family_name, full_name, given_name, name, phone_number, and role.
Organization Context - Organization Context is used to set the default value as per the name or path of the organization the user is logged in to the Wyn Enterprise application. To provide an organization context, select an option from the dropdown.
From Query - To set a default value from a query, click on the input box and select a dataset, data field, and Aggregate type (Min or Max) from the popup dialog to set the default value of the parameter. By default, the From Query option is set as None.
Binding Options
None - Select None to not bind the parameters to any dataset or slicers.
Selected Value - Choose the dataset and fields to bind the parameter.
Slicer - Select the slicers to bind the parameter.
Transform Options
Transform Rule
Original Value - To keep the original value of the Date or DateTime data type.
Transform Formats - The following formats are available in the dropdown - m/d/yyyy, d-mmm-yy, d-mmm, mmm-yy, h:mm AM/PM, h:mm:ss AM/PM, hh:mm, hh:mm:ss, and m/d/yyyy hh:mm.
Part - To keep a part of the Date or DateTime data types.
Transform Unit - The following options are available for the Date data type - Year, Quarter, Month, Week, and Day. And, the following options are available for the DateTime data type - Year, Quarter, Month, Week, Day, Hour, Minute, and Second.
Adjust Value - To adjust the value of the Date or DateTime data types.
Transform Direction - Two options are available, Backward or Forward.
Transform Unit - The following options are available - Year, Quarter, Month, Week, Day, Hour, Minute, and Second.
Transform Format - The following formats are available in the dropdown - m/d/yyyy, d-mmm-yy, d-mmm, mmm-yy, h:mm AM/PM, h:mm:ss AM/PM, hh:mm, hh:mm:ss, and m/d/yyyy hh:mm.
UTC String - To display dateTime as a string according to UTC (Universal Co-ordinated Time).
Show in the scheduled tasks Options
To show the dashboard parameters in scheduled tasks, click the Show in scheduled tasks checkbox. You can add queried or non-queried parameter values as described below,
Value Source - Select the From Query option to add a value from a dataset or Non-queried option to add values manually.
For the From Query option, select a dataset or data model from the From Query dropdown and select a data field from the Value Field dropdown.
For the Non-queried option, click the + button and enter the value and label.
Example Scenarios
Following examples illustrate the usage of Dashboard Parameters to filter scenarios,
Using Slicer to filter scenarios
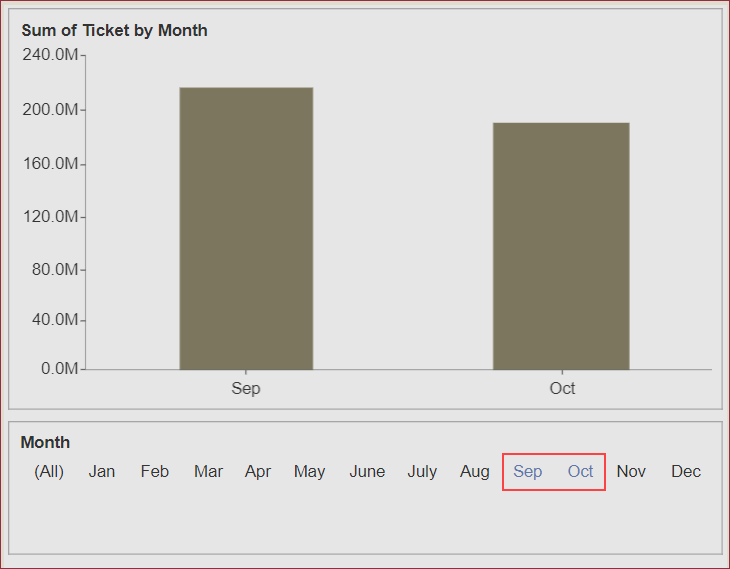
In the below example, a column chart and a slicer component is used to filter out the number of tickets for the months of September and October in a dataset of a technology company,
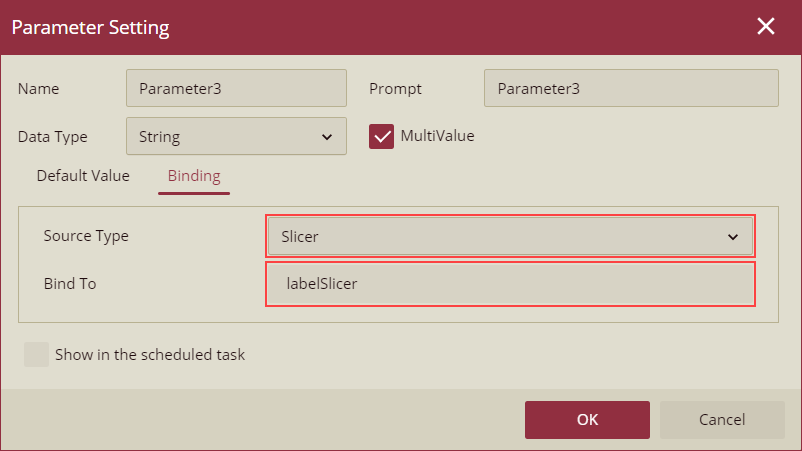
The dashboard is bound to the Technology dataset and a column chart, and a label slicer are dropped on the dashboard designer. Then, a parameter (Parameter3) is added to the dashboard scenario by using the + Add button in the Parameters property of the General section.
In the Parameter Setting dialog,
MultiValue option is selected for the parameter and the default values are set to Sep and Oct.
Parameter is bound to the Label Slicer.
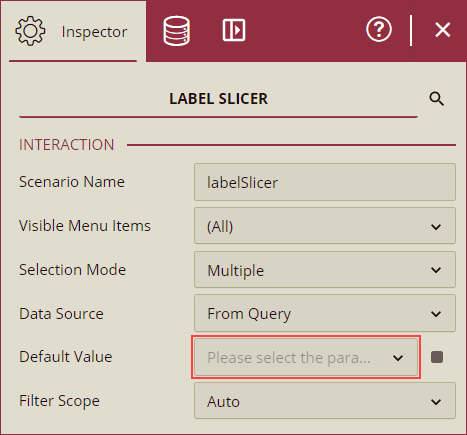
In the Interaction section of the Inspector Panel of the dashboard, Parameter3 is selected from the Default Value property dropdown to bind the parameter to the slicer.
When the dashboard is previewed, the label slicer bound to Parameter3 automatically filters the data in the column chart for the default values Oct and Sep.
Multi-dimension Parameters
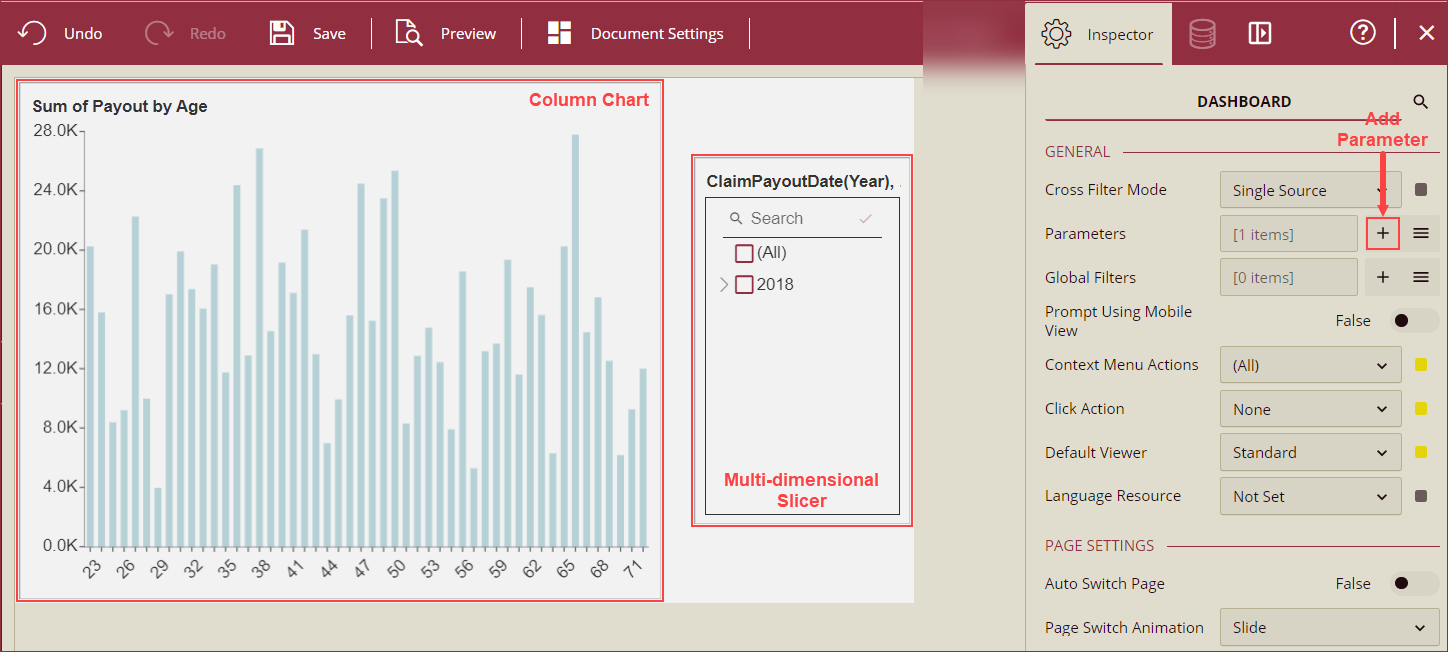
In the below example, a column chart and a multi-dimensional slicer (also known as Tree Slicer) is used to filter out the sum of payout for months in a year in a dataset of an insurance company,
Dashboard is bound to the Insurance dataset and a column chart, and a multi-dimensional slicer are dropped on the dashboard designer. Then, a parameter (P1) is added to the dashboard scenario by using the + Add button in the Parameters property of the General section.
In the Parameter Setting dialog,
Multi Dimension option is selected from the Data Type dropdown and the parameter is bound to the slicer component by selecting Slicer as the Source Type. Multi-dimensional slicer is bound to the parameter from the Slicer Value Settings dialog by clicking the Bind To input box.
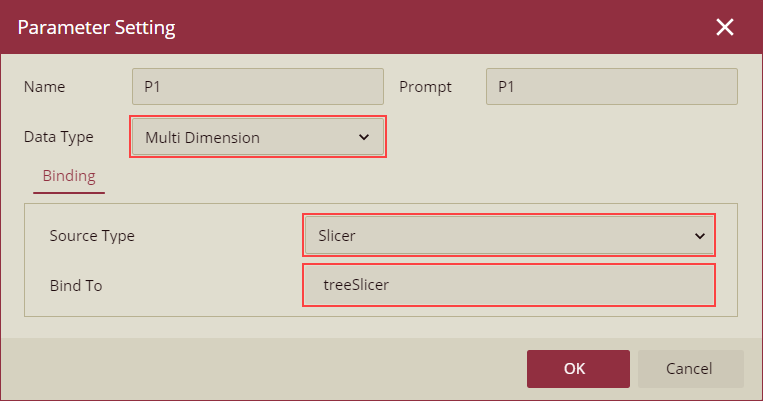
From the Slicer Value Setting dialog, treeSlicer option is selected from the Choose Slicer dropdown, and all the columns are selected using the checkboxes from the Choose Column section.

From the Interaction section of the Inspector Panel of the dashboard, parameter P1 is selected from the Default Value property dropdown to bind the parameter to the slicer.
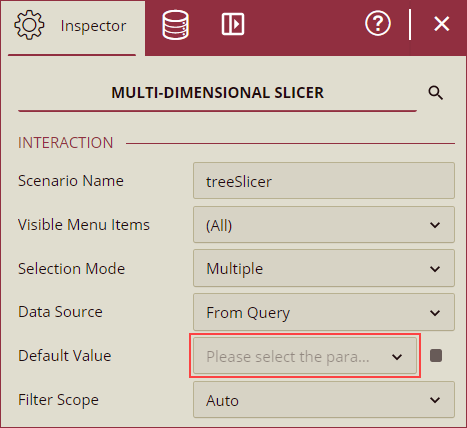
When the dashboard is previewed, the multi-dimensional slicer bound to the parameter P1 is used to filter out data for the selected year, month, and dates.
